B2B lead generation metrics typically include conversions, conversion rate, and cost-per-conversion. While these metrics are essential to understanding marketing results, they should not be the primary measurement of your success.

Move Beyond Conversion Metrics
B2B marketers often have a myopic focus on conversions. A “conversion” could be a contact form, a webinar registration, an asset download, a demo/trial request, or any other desirable action. Typically, a conversion is a completed registration form.
Conversion data is important. BUT, if your goal is to prove that your marketing program contributes to bottom-line business results, conversion metrics are not sufficient.
Utilize Pipeline Progression Data
How can marketers prove business value? A great place to start is understanding how marketing-driven conversions progress through the sales pipeline. With pipeline progression reporting, all marketing channels, activities, and campaigns are analyzed based on how they contribute to the pipeline.
Essentially, the source of each conversion, whether it be organic, paid, social, or email is passed into Customer Relationship Management (CRM) and Marketing Automation platforms to produce attributed pipeline data. Various attribution models (first-touch, last-touch, multi-touch, etc.) attribute leads in different ways — a topic for another post!
The more specific your attribution, the better. For example, it’s probably not sufficient to just know that the source of a lead is paid media. To make this data useful and usable, you must understand which ad channel and which ad campaign drove the lead into the pipeline.
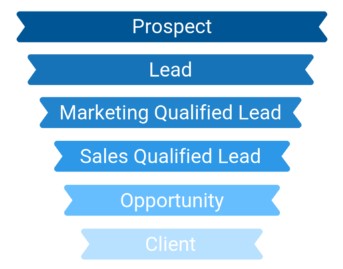
It is critical for B2B marketers to understand how marketing-driven conversions progress (or don’t) into qualified marketing leads, qualified sales leads, sales opportunities, and closed sales. By understanding this progression, marketers can optimize efforts and allocate funds based not on conversions (registration form completions), but on actual contribution to the sales pipeline.
Here is an example of common labels for pipeline progression:
Prove Marketing Return on Investment (MROI)
Too many Marketing Performance Dashboards focus exclusively on conversions and cost-per-conversion. I urge marketers to take the next step. Import attributed pipeline data into your dashboard, and measure success based on pipeline progression, contribution to revenue, and MROI.
Of course, determining return on investment requires an understanding of what a customer is worth to your business. All solid MROI calculations require an estimated Customer Lifetime Value (CLV). More to come on this…
Benefits of an ROI Dashboard
At Avid Demand, all clients receive a Digital ROI Dashboard that includes pipeline progression data and proves Marketing ROI (MROI). These dashboards allow us to:
- Ensure our client succeeds
- Engage executives
- Justify marketing investment
- Expand marketing programs
Please reach out if you’d like to see an example of an ROI Dashboard.